
1. Key messages
- The Belgian diet is characterized by excessive consumption of red meat, processed meat and sugar sweetened beverages, and by insufficient consumption of fruits, vegetables, nuts and seeds, milk, eggs and fish. Over time, these patterns have only slightly improved.
- In 2018, only 12.7% of the population aged 6 years and over consumed the daily recommended amount of fruit and vegetables (at least 5 portions).
- In 2018, 20.4% of the population drank sugary drinks on a daily basis; 4.1% even drank a litre or more daily.
- Women, older people, people with a tertiary education and people living in Brussels had better nutritional habits.
2. Background
Dietary quality is an important factor in health and disease burden. A healthy diet helps protect against non-communicable diseases (NCDs) including diabetes, cancer, heart disease and stroke [1]. Recommendations for each food groups have been established at international [2] and national [3,4] levels.
In Belgium, information on dietary consumption patterns are available from two national Food Consumption Surveys (FCS), conducted in 2004 and 2014 [5–7]. More data about the nutritional habits are available from the Belgian Health Interview Survey (HIS) in 2001, 2004, 2013, 2018 [8]. Data from the FCS are obtained from 24h dietary recalls, while the HIS uses self-reported usual food habits questions, which are more prone to biases linked to recollection and adequate estimation of quantities.
In this report, we present consumption patterns from the FCS and two additional indicators from the HIS:
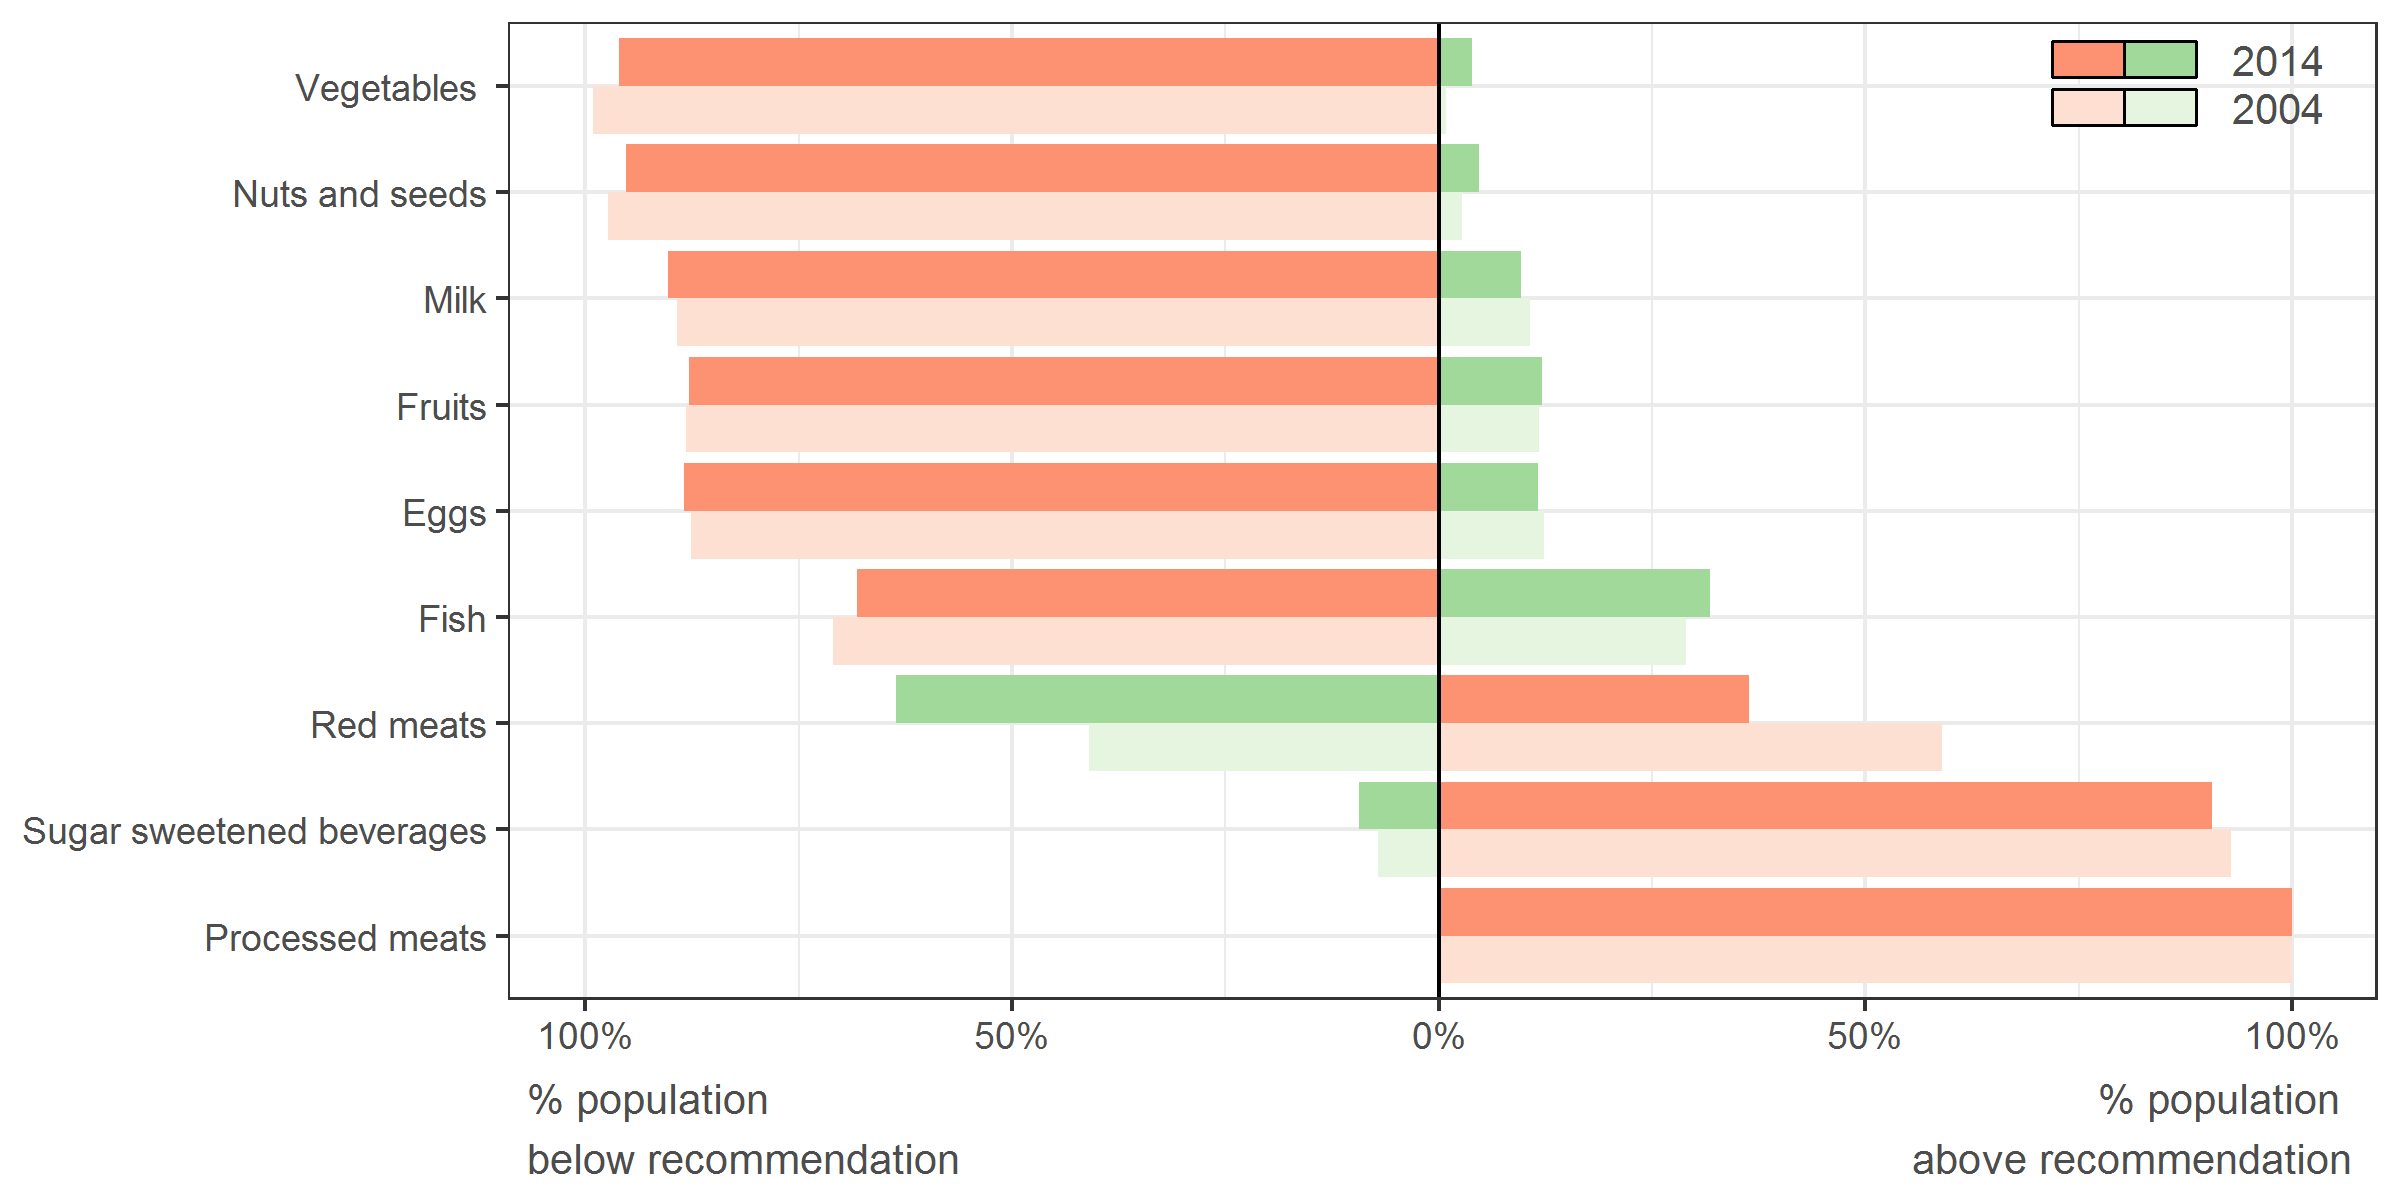
- The consumption patterns for 9 food groups (vegetables, nuts and seeds, milk, fruits, eggs, fish, red meats, sugar sweetened beverages, processed meats) are compared against international recommendations in 2004 and 2014 [2].
- The proportion of the population aged 6 years and over that consumes the daily recommended amount of fruits and vegetables (at least 5 portions). Fruit and vegetables are low-energy density foods and are important sources of dietary fibre, vitamins and minerals. A high consumption of fruit and vegetables has been significantly associated with a decrease in the risk of coronary heart disease, stroke and obesity [9]. The WHO recommends a daily consumption of 400 grams of fruit and vegetables (i.e. 5 portions) [10].
- The proportion of the population that drinks sugary drinks (no "diet") daily and those that drink at least 1 litre of sugary drinks (no "diet") daily. A high intake of free sugars, particularly in the form of sugar-sweetened beverages, is associated with poor dietary habits, unhealthy weight gains, risk of dental carries and other NCDs [1,9]. The WHO strongly recommends restricting the intake of free sugars to less than 10% of the total energy consumption, throughout the life course [11]. With respect to this guideline the consumption of sugar-sweetened beverages should be avoided.
3. Overall consumption patterns
Overall, the Belgian diet is characterized by excessive consumption of red meat, processed meat and sugar sweetened beverages and by insufficient consumption of fruits, vegetables, nuts and seeds, milk, eggs and fish. Overall, these patterns have only slightly improved between 2004 and 2014. For red meat consumption, however, an improvement was observed, with the proportion of excessive consumptions dropping from 59% to 36%.
Source: Food Consumption Survey, Sciensano [7]
4. Consumption of fruits and vegetables
Situation in 2018
Belgium
In 2018, 12.7% of the population aged 6 years and over consumed the daily recommended amount of fruit and vegetables (at least 5 portions). More women (15.6%) than men (9.8%) consumed the recommended amount. Children and young adults were less likely to meet the recommendations than middle-aged and older adults.
Source: Health Interview Survey, Sciensano [8]
Regional differences
In men as in women, after age standardization, more people were meeting the recommendations on daily fruit and vegetable consumption in Brussels (13.3% in men and 19.2% in women) and Wallonia (12.5% and 18.0%) than in Flanders (8.7% and 14.7%).
Source: Own calculations based on Health Interview Survey, Sciensano [8]
Socio-economic disparities
The socio-economic position has a strong influence on the probability of meeting the recommendations concerning the consumption of fruits and vegetables (at least 5 portions). People with a tertiary education (18.0%) were 2.9 times more likely to meet the recommendations than those from the lowest education group (6.3%). People with a secondary education (9.2% to 9.9.%) were also nearly twice less likely to meet the recommendations than people with a tertiary education.
Source: Own calculations based on Health Interview Survey, Sciensano [8]
International comparison
The consumption of at least 5 portions of fruits and vegetables daily was lower in Belgium compared to the EU-15 average in 2019, for both men (11.8% vs 13.6%) and women (18.2% vs 19.9%).
- Men
- Women
Prevalence of men aged 15 years and over that eats daily the recommended amount of fruits and vegetables (at least 5 portions), by country of residence EU-15, 2019
Source: Eurostat [12]
Prevalence of women aged 15 years and over that eats daily the recommended amount of fruits and vegetables (at least 5 portions), by country of residence EU-15, 2019
Source: Eurostat [12]
5. Consumption of sugary drinks
Situation in 2018
Belgium
In 2018, 20.4% of the population drank sugary drinks on a daily basis; 4.1% of the population even drank at least 1 litre or more per day. More men (24.9%) than women (16%) drank sugary drinks daily. The prevalence of daily consumption was higher amongst those aged 15-24 and 25-34 (29.2% and 28.6%, respectively) and decreased in older age groups.
Source: Health Interview Survey, Sciensano [8]
Regional differences
The prevalence of the population that consumes sugary drinks daily is 16.3% in Brussels, 20.1% in Flanders, and 22.9% in Wallonia.
Trends
Belgium
There were less people drinking sugary drinks in 2018 (20.4%) than in 2013 (25.5%). This trends was observed both in men (decreasing from 30.2% in 2013 to 24.9% in 2018) and women (from 21.1% to 16%).
- Men
- Women
Age-adjusted prevalence of men that drink sugary drinks (no "diet") daily, by region, Belgium, 2013-2018
Source: Own calculations based on Health Interview Survey, Sciensano [8]
Age-adjusted prevalence of women that drink sugary drinks (no "diet") daily, by region, Belgium, 2013-2018
Source: Own calculations based on Health Interview Survey, Sciensano [8]
Regional differences
After adjustment for age, the same decreasing trend was observed in the three regions.
Socio-economic disparities
Based on age-adjusted prevalence, people with a tertiary education were less likely to consume sugary drinks daily compared to people with a lower educational level.
Source: Own calculations based on Health Interview Survey, Sciensano [8]
6. Read more
View the metadata for this indicator
HISIA: Interactive Analysis of the Belgian Health Interview Survey
Definitions
- Age-adjusted prevalence
- Since lifestyle factors are strongly influenced by age, comparisons among regions and educational levels need to be standardized by age to have a similar age structure.
References
- Amine EK, Baba NH, Belhadj M, Deurenberg-Yap M, Djazayery A, Forrestre T, et al. Diet, nutrition and the prevention of chronic diseases. World Health Organization; 2003.
- GBD 2017 Risk Factor Collaborators. Global, regional, and national comparative risk assessment of 84 behavioural, environmental and occupational, and metabolic risks or clusters of risks for 195 countries and territories, 1990-2017: a systematic analysis for the Global Burden of Disease Study 2017. Lancet. 2018.
- Vanhauwaert E. De actieve voedingsdriehoek: een praktische voedings- en beweeggids. Brussel; 2012.
- Lebacq T, Oost C. Recommandations alimentaires. In: Tafforeau J, editor. 2016.
- De Ridder K, Bel S, Brocatus L, Lebacq T, Ost C, Teppers E. La consommation alimentaire. Résumé des principaux résultats. In: Teppers E, Tafforeau J, editors. Bruxelles: WIV-ISP; 2016.
- Debacker N, Cox B, Temme L, Huybrechts I, Van Oyen H. De Belgische voedselconsumptiepeiling 2004: voedingsgewoonten van de Belgische bevolking ouder dan 15 jaar. Wetenschappelijk Instituut Volksgezondheid; 2007.
- Sciensano. Website of the Belgian National Food Consumption survey 2014. https://fcs.wiv-isp.be/SitePages/Home.aspx.
- Drieskens S, Charafeddine R, Gisle L. Enquête de santé 2018: Habitudes nutritionnelles [Internet]. Bruxelles, Belgique: Sciensano. Available from: https://www.sciensano.be/en/projects/health-interview-survey
- EFSA Panel on Dietetic Products, Nutrition, and Allergies (NDA). Scientific opinion on principles for deriving and applying dietary reference values. 2010.
- World Health Organization. Diet, nutrition, and the prevention of chronic diseases. Report of a WHO Study Group. Geneva: World Health Organization;1990.
- World Health Organization. Guideline: sugars intake for adults and children. Geneva: World Health Organization; 2015.
- Eurostat. http://ec.europa.eu/eurostat/fr/data/database
Please cite this page as: Sciensano. Determinants of Health: Nutritional habits, Health Status Report, 31 July 2020, Brussels, Belgium, https://www.healthybelgium.be/en/health-status/determinants-of-health/nutritional-habits