The codes mentioned above can be used in rates and expenses, or only in expenses. We invite you to consult the full report for more information. Below is a graph showing the evolution of the breakdown by volume of nomenclature codes used for the rates:
No selection
2022
WE ARE INTERESTED IN YOUR OPINION Do you have any experience in this area ? We listen to you !
On this table, when a statistical test has been performed, the data showing a significant difference is displayed on an yellow background, otherwise on a grey background.
CODES
LABEL
CREATION
DELETION
558773
558784Manipulations vertébrales (attestable une fois par jour et maximum 3 fois par patient pour un même traitement)
01-01-1991

 Nomenclature codes
 Age, gender and CV
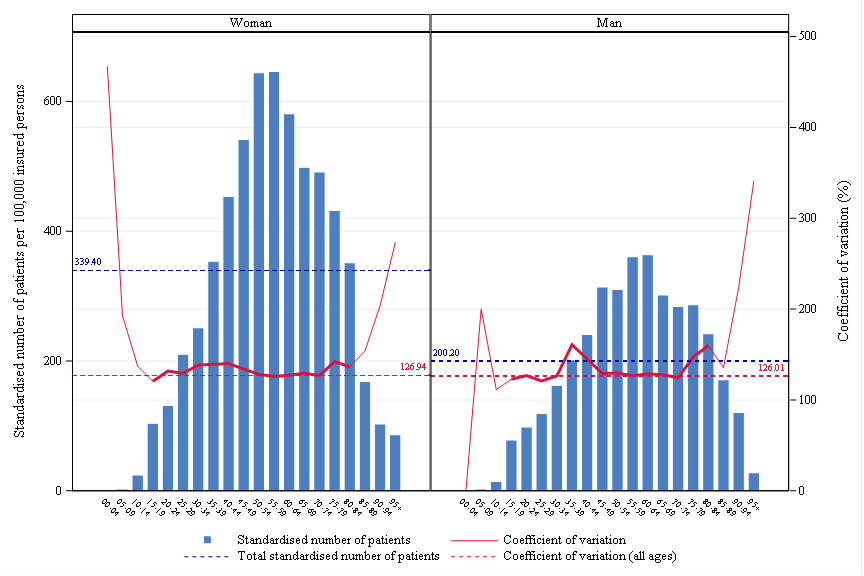
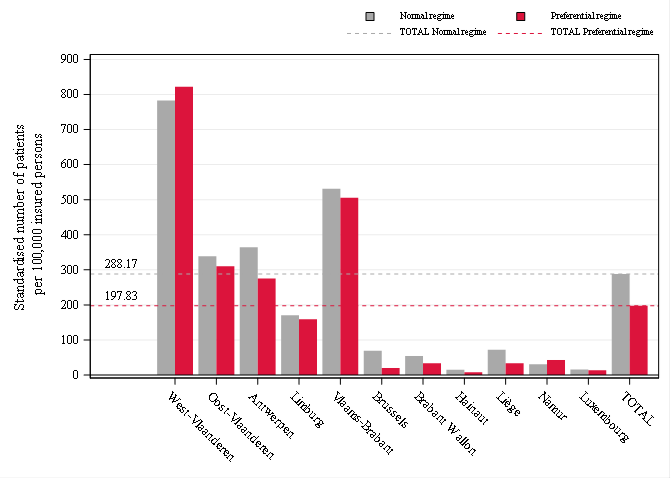
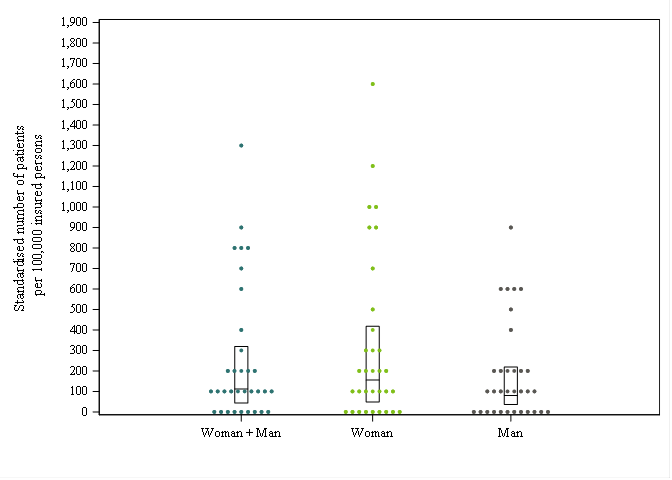
 Rates by sex
 Reimbursement rate
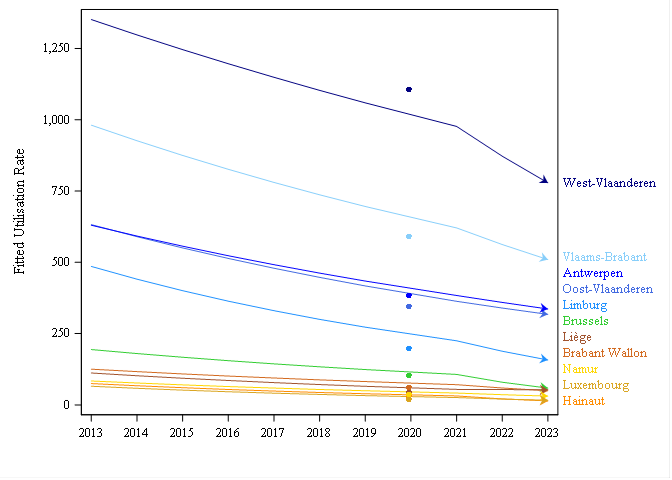
 Trends by region
 Trends break
 Dot Plot
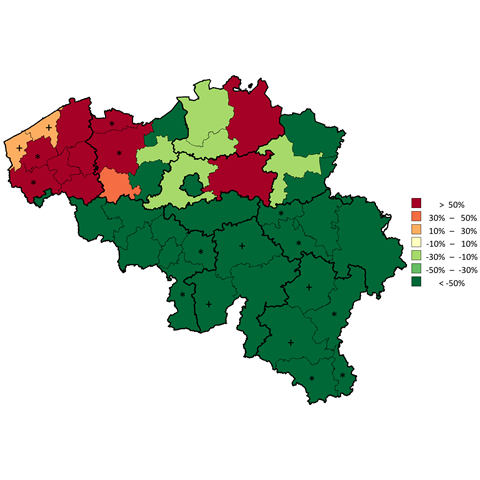
 Distribution map
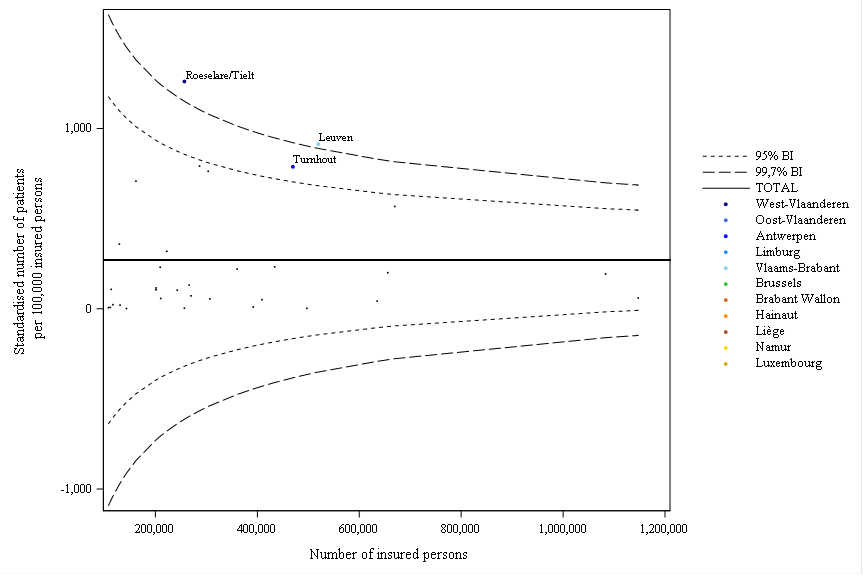
 Funnel plot
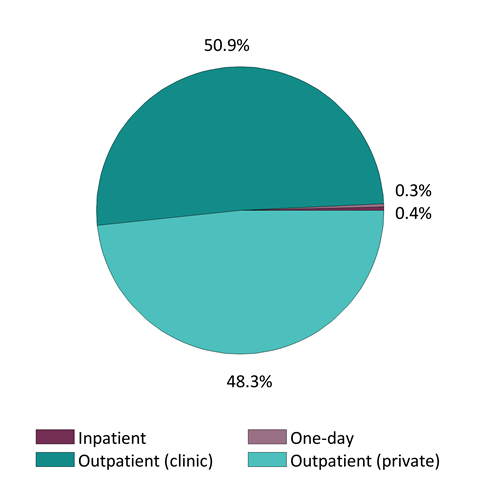
 Patient care settings
 Occurrences by Province
 National Occurrences
Download the methodology
Other official information and services: www.belgium.be 