The codes mentioned above can be used in rates and expenses, or only in expenses. We invite you to consult the full report for more information. Below is a graph showing the evolution of the breakdown by volume of nomenclature codes used for the rates:
Older than or equal to 50 years
2022
WE ARE INTERESTED IN YOUR OPINION Do you have any experience in this area ? We listen to you !
On this table, when a statistical test has been performed, the data showing a significant difference is displayed on an yellow background, otherwise on a grey background.
CODES
LABEL
CREATION
DELETION
455895
455906Examen réalisé par la technique de l'absorptiométrie radiologique à double énergie (Dual Energy X-ray Absorptiometry : DXA) pour déterminer le T-score, calculé au niveau de la colonne lombaire (L1-L4 ou L2-L4) et de la hanche (zone totale ou zone propre du col)
01-08-2010
466616
466620Examen réalisé par la technique de l'absorptiométrie radiologique à double énergie (Dual Energy X-ray Absorptiometry : DXA) pour déterminer le T-score, calculé au niveau de la colonne lombaire (L1-L4 ou L2-L4) et de la hanche (zone totale ou zone propre du col)
01-08-2010

 Nomenclature codes
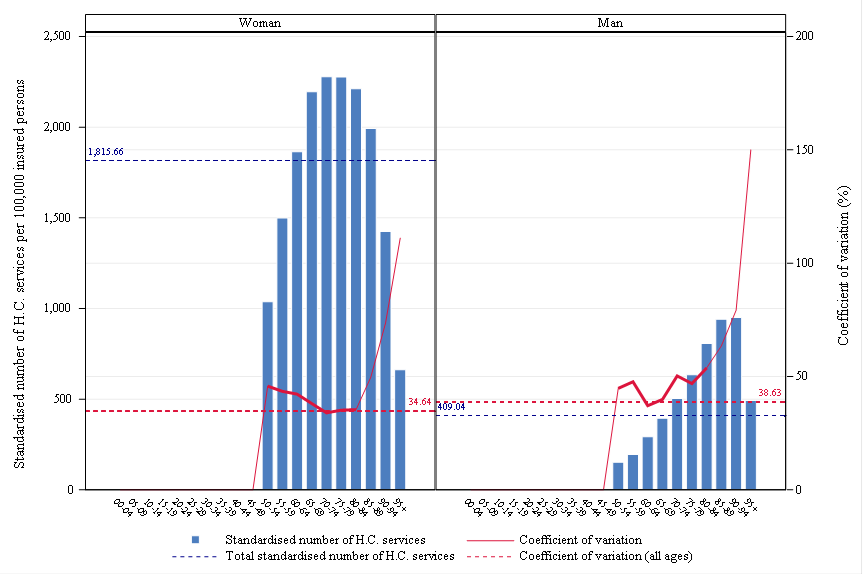
 Age, gender and CV
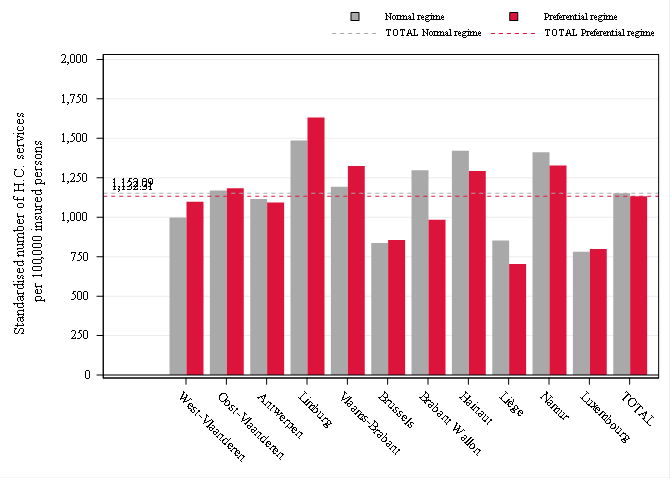
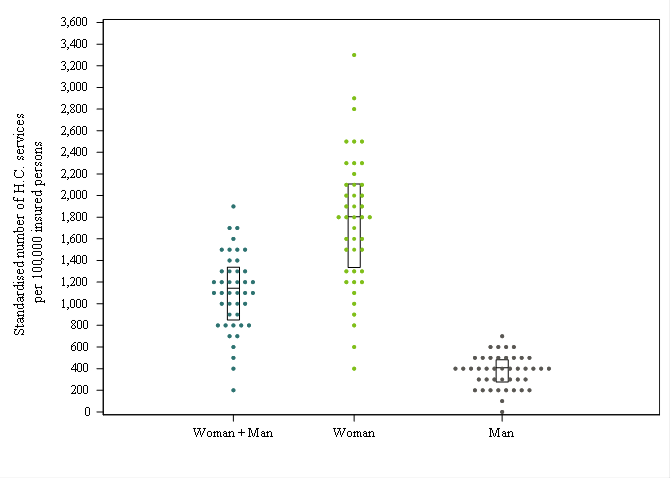
 Rates by sex
 Reimbursement rate
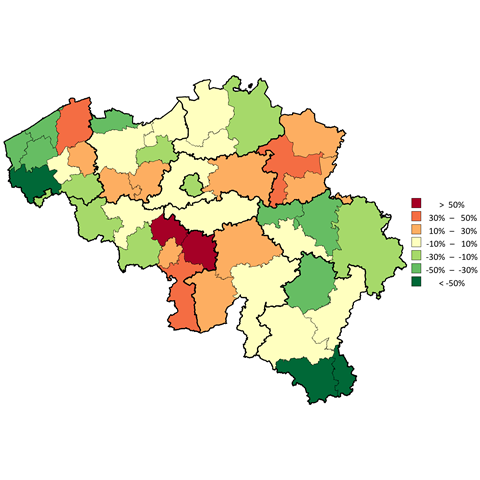
 Trends by region
 Trends break
 Dot Plot
 Distribution map
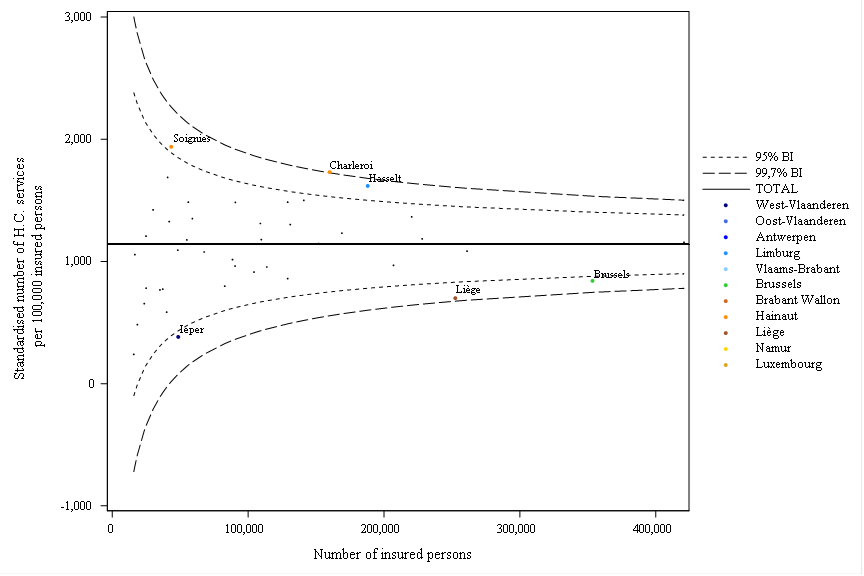
 Funnel plot
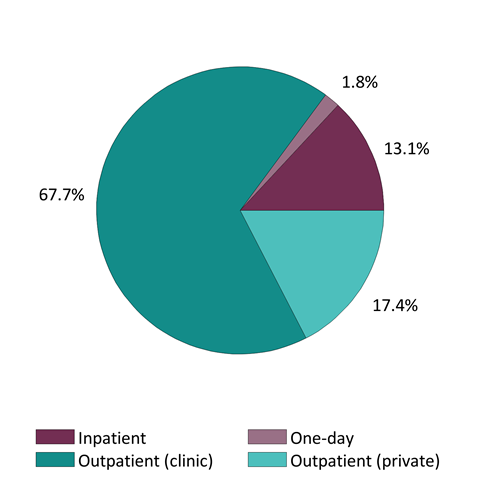
 Patient care settings
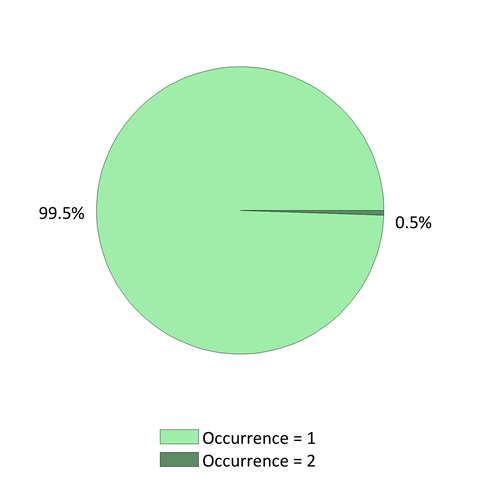
 Occurrences by Province
 National Occurrences
Download the methodology
Other official information and services: www.belgium.be 