The codes mentioned above can be used in rates and expenses, or only in expenses. We invite you to consult the full report for more information. Below is a graph showing the evolution of the breakdown by volume of nomenclature codes used for the rates:
No selection
2022
WE ARE INTERESTED IN YOUR OPINION Do you have any experience in this area ? We listen to you !
On this table, when a statistical test has been performed, the data showing a significant difference is displayed on an yellow background, otherwise on a grey background.
CODES
LABEL
CREATION
DELETION
460051
460062Echographie bidimensionnelle avec protocole écrit et support iconographique issu d'un traitement digital des données quel que soit le nombre d'échogrammes : Transfontanellaire du contenu du crâne
01-06-1991
469313
469324Echographie bidimensionnelle avec protocole écrit et support iconographique issu d'un traitement digital des données quel que soit le nombre d'échogrammes : Transfontanellaire du contenu du crâne
01-04-2003

 Nomenclature codes
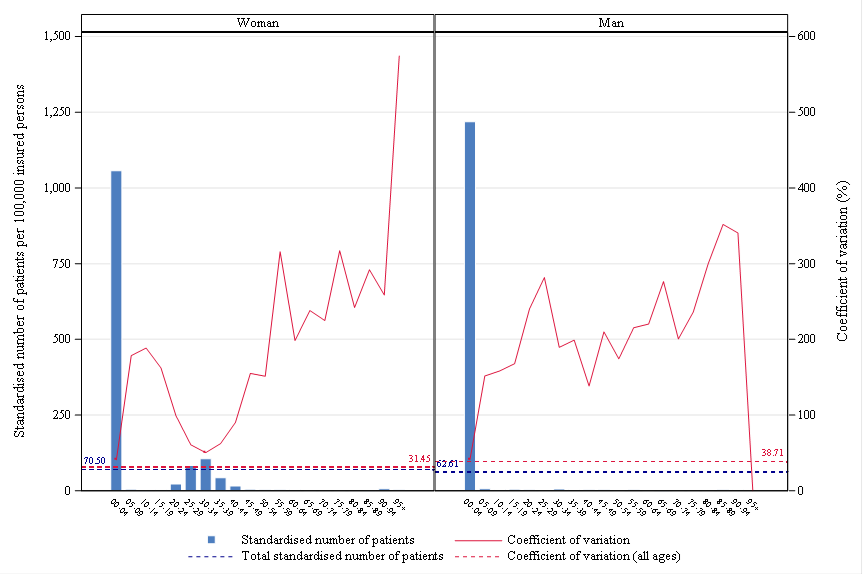
 Age, gender and CV
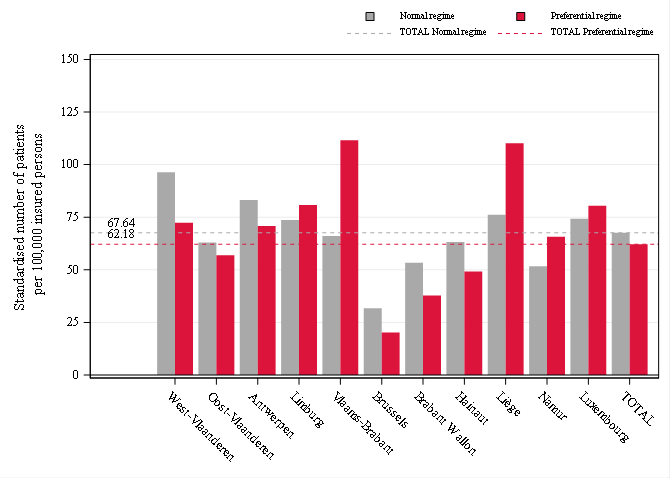
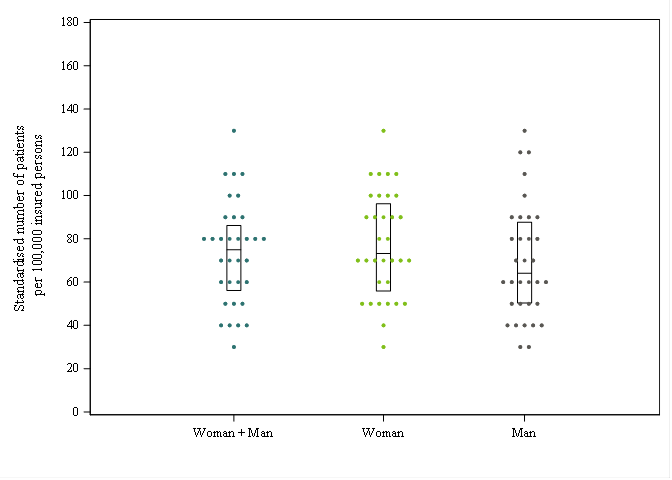
 Rates by sex
 Reimbursement rate
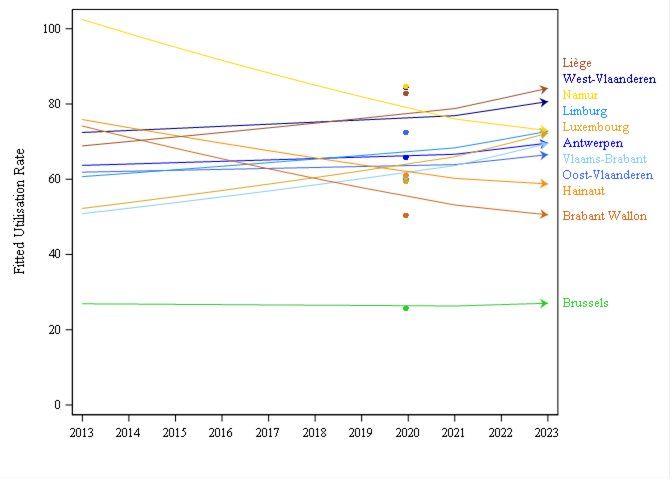
 Trends by region
 Trends break
 Dot Plot
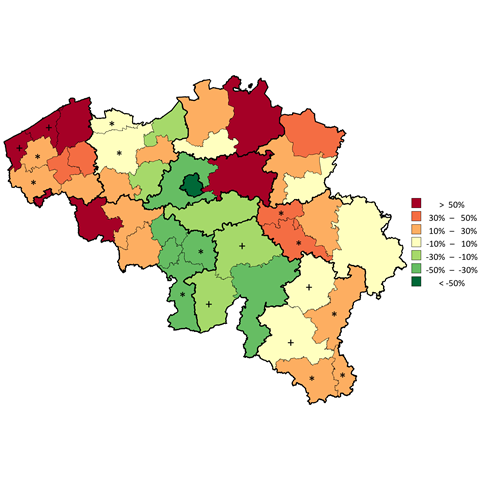
![]() Distribution map
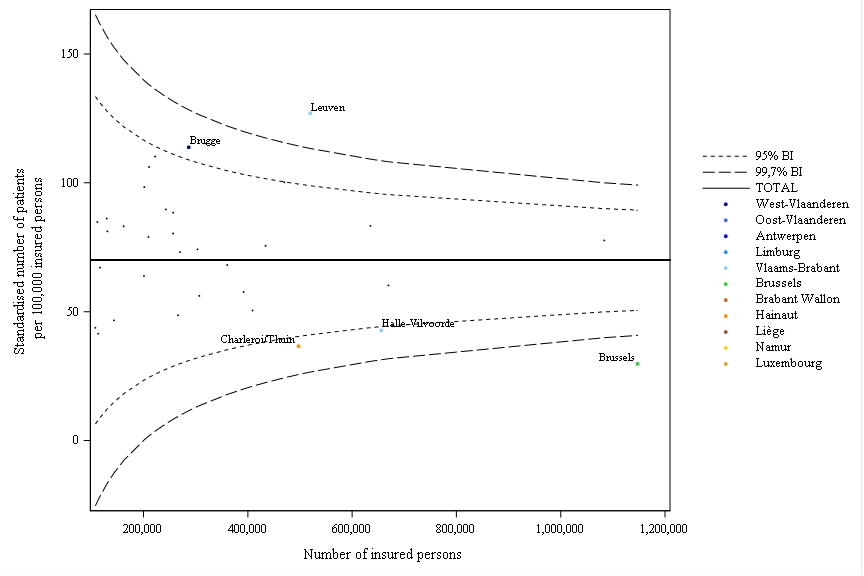
Distribution map Funnel plot
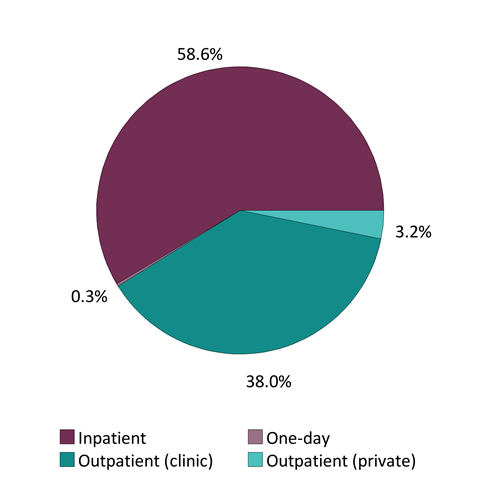
 Patient care settings
 Occurrences by Province
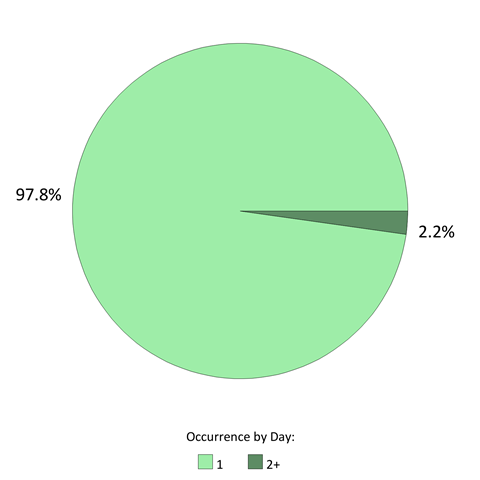
 National Occurrences
Download the methodology
Other official information and services: www.belgium.be 